
The development of the High Injury Network (HIN) is a key element of Oakland Department of Transportation’s (OakDOT)’s data-driven traffic safety initiative, Safe Oakland Streets (SOS). In alignment with Vision Zero cities around the world, OakDOT seeks to reduce and ultimately eliminate fatal and severe crashes in our city. Identifying corridors with the highest density of fatal and severe crashes (FSI) helps us to focus efforts and prioritize our limited resources and investments on the streets in most need of safety enhancements. The HIN also serves to communicate OakDOT’s priority on safety to elected officials and other community stakeholders.
HIN 2024 Webmap
HIN 2024 Tables
Purpose
Presentation
Usage
The HIN is used for resource allocation decisions at OakDOT related to traffic safety including:
- Capital Improvement Plan
- Grant Applications
- Speed Safety Camera Pilot Program (AB 645)
HIN Methodology
The 2024 HIN is an update to the 2018 HIN.
Data Inclusion
In alignment with best data practices, the 2024 HIN utilizes the most recent 5 years of finalized crash data from 2017-2021. For comparison, the 2018 HIN utilized crash data covering 2012-2016.
Weighting
OakDOT’s 2018 and 2024 HINs were created by combining 3 separate mode-specific HINs: pedestrian, bicyclist and motor vehicle. Creating separate HINs allows the pedestrian and bicyclist crash networks to be analyzed distinct from the motorist network, which might otherwise dominate the map. The Motor Vehicle HIN uses only fatal and severe injury (FSI) crashes. The pedestrian and bicyclist maps add 'Other Visible Injury' crashes at a weight of one third FSIs.
| Crash Severity | Weight - Motorist HIN | Weight Bike/Ped HIN |
|---|---|---|
Fatal |
3 | 3 |
Severe Injury |
3 | 3 |
Other Visible Injury |
0 | 1 |
Other Complaint of Pain |
0 | 0 |
Property Damage Only |
0 | 0 |
This High Injury Network meets the requirements of Safety Corridor designations according to the 2014 California Manual on Uniform Traffic Control Devices (MUTCD), Revision 7 (2023).
The California Vehicle Code 22358.7(a)(1) specifies that (12q) safety corridors shall
- Identify specific locations with high crash occurrences.
- Identify corridor-level segments with a pattern of crash reoccurrence.
- Be able to be stratified by mode.
(12r) Safety corridors shall represent a prioritized subset of the overall roadway network within an authority’s responsibilities and shall not exceed one-fifth of the overall roadway network.
(12s) A jurisdiction should use three to five years of the most recent crash data to determine a safety corridor based on Fatal and Serious Injury data.
(12t) For crash coverage, safety corridors may identify the subset of the overall roadway network where a minimum of 25% of the Fatal + Serious Injury (F+SI) crashes occur.
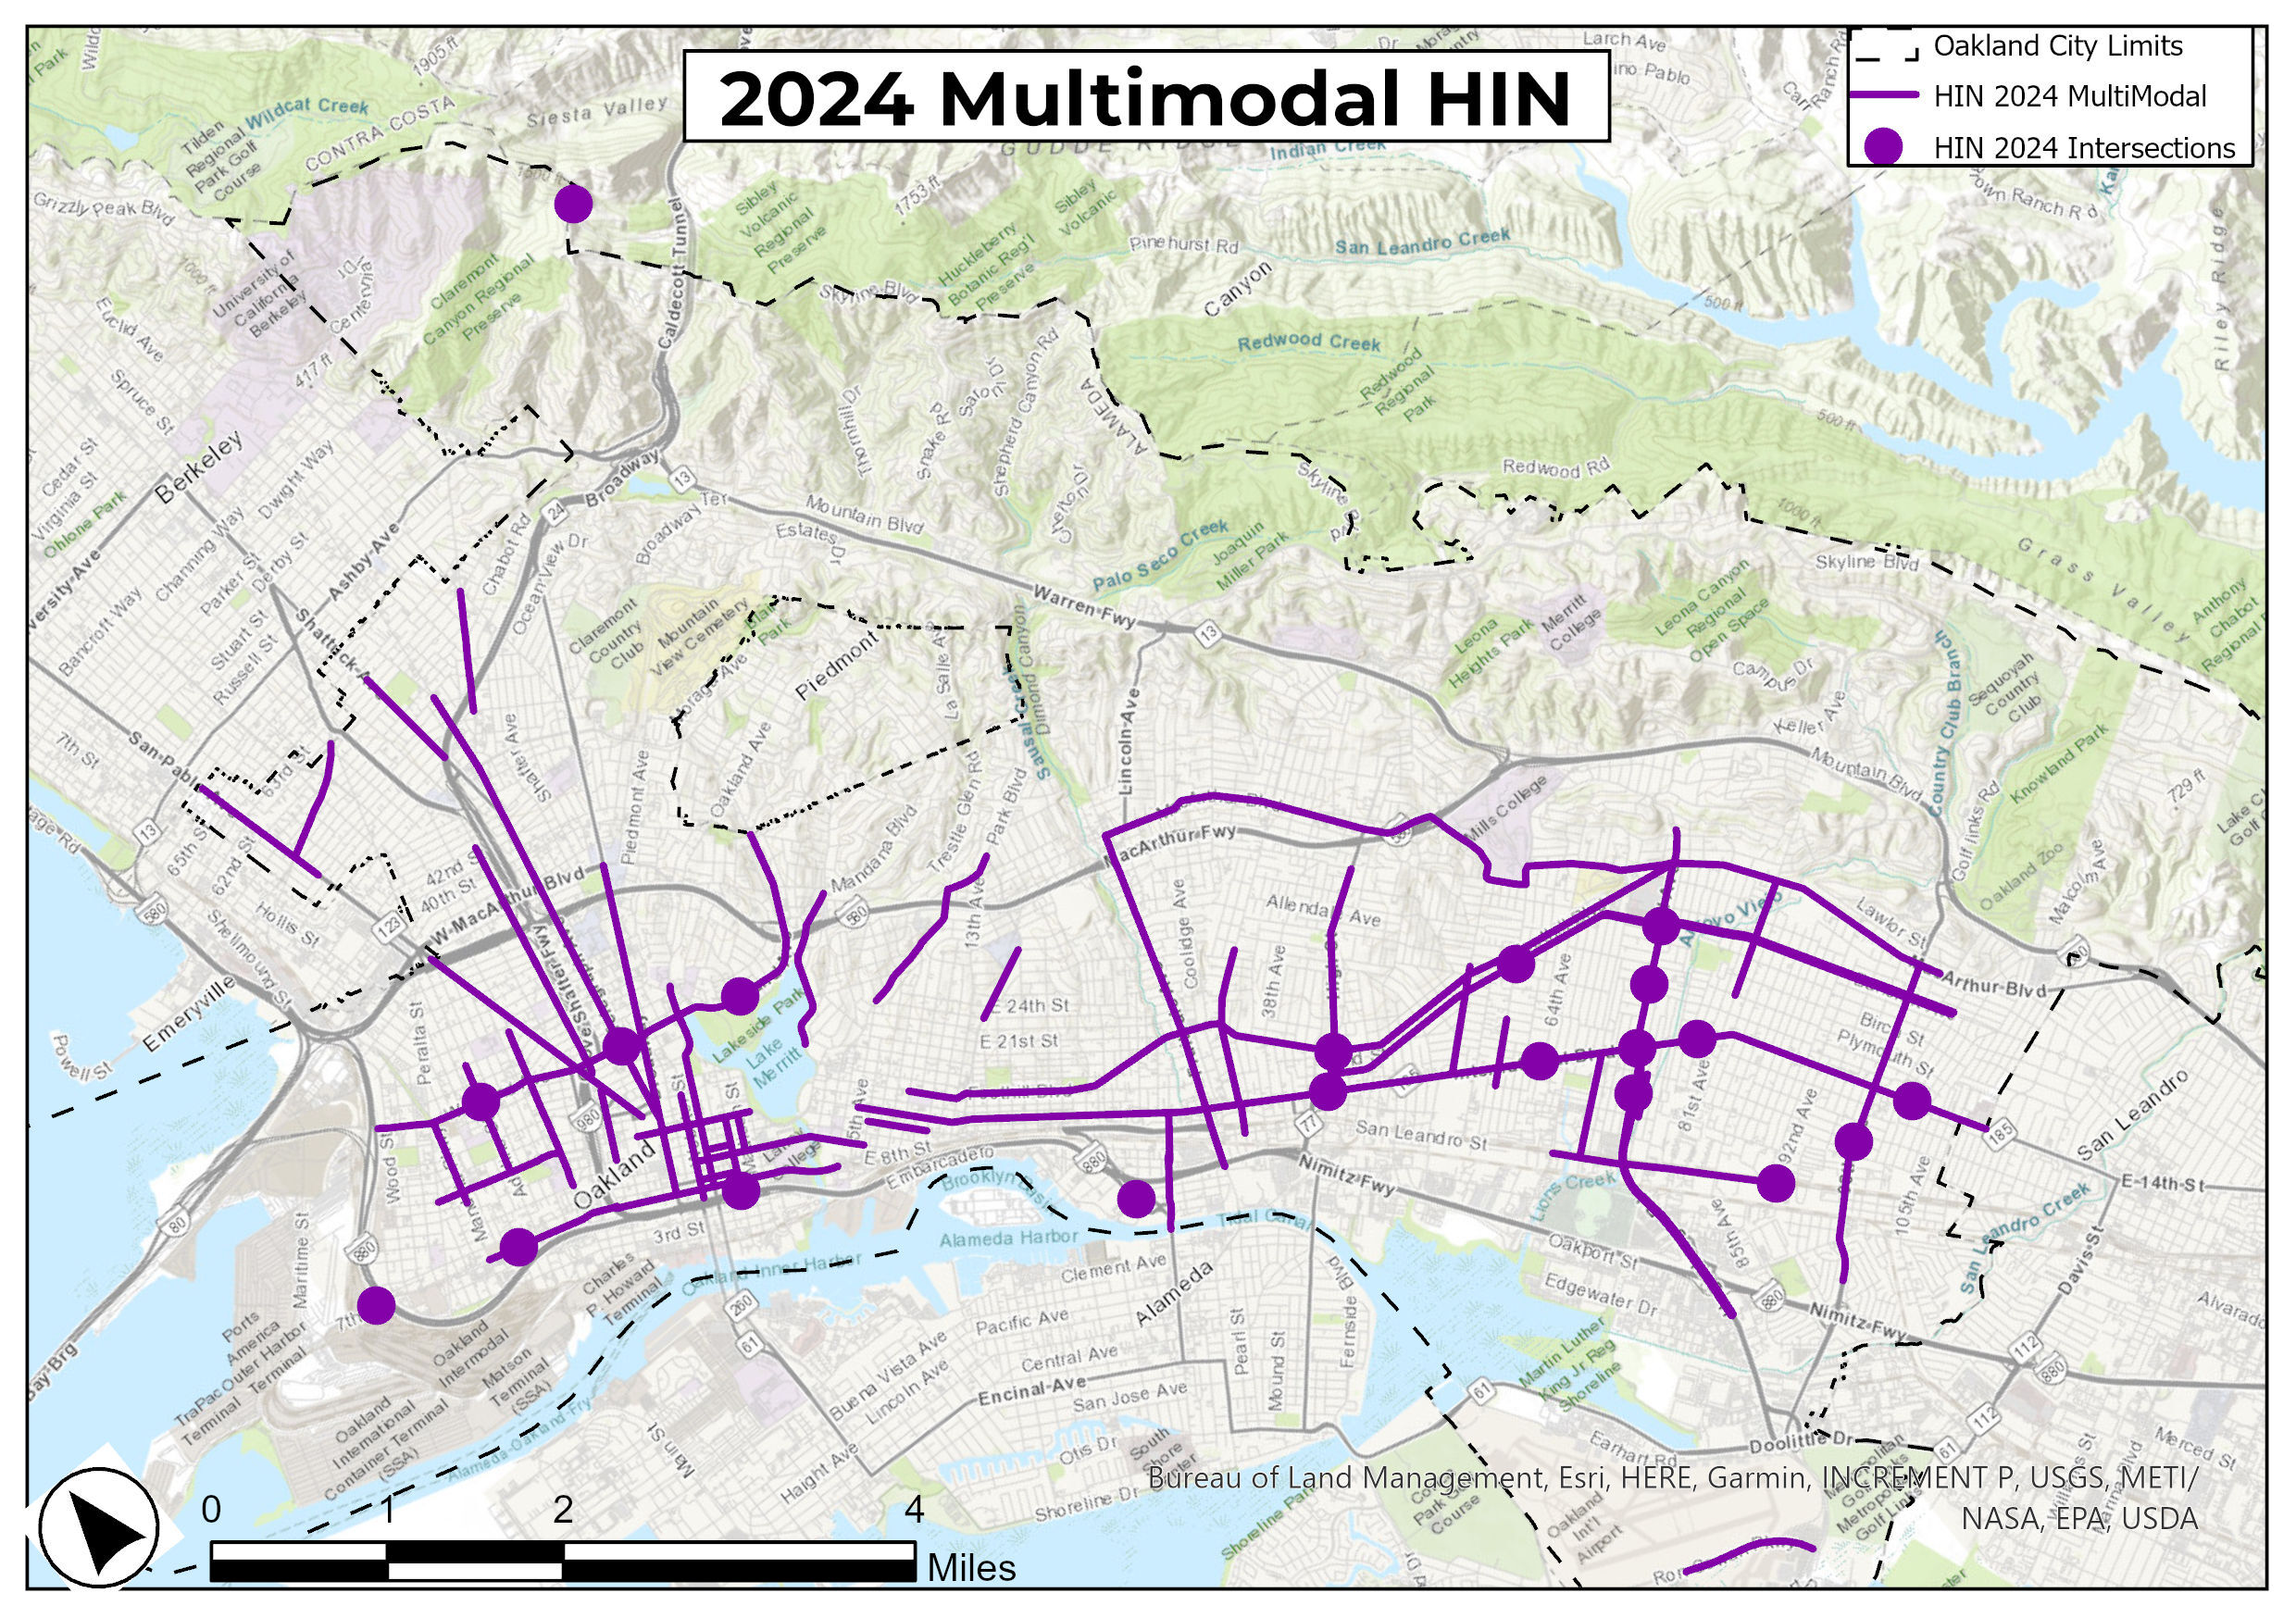
The 2024 HIN is stratified by mode, includes 5 years of crash data from and represents the 8% of Oakland streets responsible for 60% of severe and fatal collisions.
2018 HIN - 2024 HIN Comparison
| HIN Year | % FSIs on HIN | % of Oakland Streets |
|---|---|---|
2024 |
60% | 8% |
2018 |
64% | 8% |
Posted: June 4th, 2024 3:26 PM
Last Updated: September 17th, 2024 12:27 PM